The WA State 3D Geomodel 2021 is an attempt to visualise in 3D the components of Earth’s crust in Western Australia. The model has been generated using the 1:2 500 000 Major Crustal Boundary shape file as the major input. This division of the crust into 3D volumes is the result of careful integration of geological and geophysical datasets and existing 3D geomodels. Surface geological mapping is the first reference for the model. Where the surface rocks are covered by regolith, aerial magnetic surveys, as well as ground and aerial gravity surveys provide images from which the geology can be inferred. Depth information can be inferred from these, but data enhancements such as multiscale edge detection (worms) assisted with ascertaining dip direction where no depth information was available.
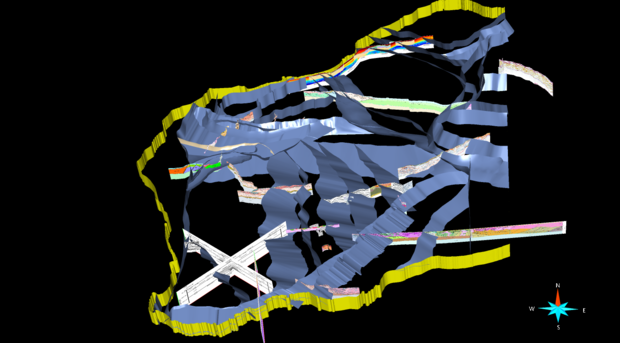
Early investigations into the velocity layering of the WA crust were in the form of seismic refraction surveys which showed there was a change in seismic velocity within the crust. In the past 30 years, profiles of active source deep-crustal seismic reflection and magnetotelluric (MT) surveys have been conducted by Geoscience Australia and the Geological Survey of Western Australia. These profiles provide information on the boundaries (Fig.1) and layering within the crust, as well as the depth of the Moho and the dip of some major faults and seismic provinces (i.e. discrete volumes within the middle to lower crust that cannot be traced to the surface, and whose crustal reflectivity is different to that of laterally or vertically adjoining provinces). Ambiguities are still present due to the fact that the profiles only sample a very small part of the State and are 2D profiles sampling 3D geology.
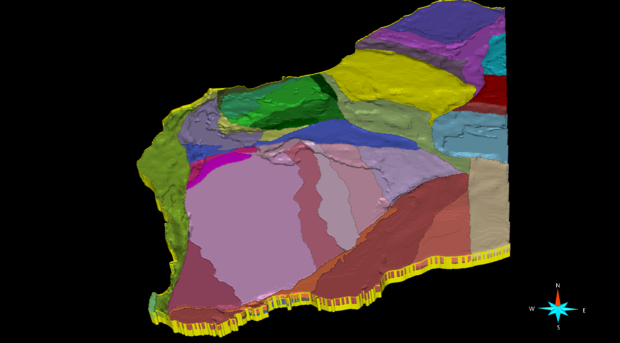
More recently, passive seismic campaigns have covered specific areas of the State. These examine the waveforms of distant earthquakes, sampling the crust directly below the station to image the structure and nature of the crust. This is used to calculate the thickness and composition of the crust. Correlating the noise signals at two stations across every station pair in an array gives a tomographic image of the velocity structure allowing differentiation of the crust into blocks of different age and origin (Fig. 2).
MT surveys have been conducted along several seismic profiles, often coincident with seismic reflection lines. These sample the electrical conductivity of the crust and upper mantle, and have helped define crustal boundaries between the upper and lower levels of the crust.
Many parts of the State are covered by deep basins of Proterozoic age and by younger basins. These are captured within the OZ SEEBASE model in conjunction with mapped geology and seismic and MT profiles. The Archean Fortescue and Hamersley Basins are also modelled.
The major crustal boundaries have been determined by considering all the above geological and geophysical data. They have been named with regard to the rock unit adjoining the boundary or as internal to a tectonic volume. These internal faults/shear zones have been included as they are thought to be major transcrustal features. In many cases the boundaries follow faults or shear zones as detailed in the State interpreted bedrock structural layer 1:500 000 (2106) and summarised below. More explanations about the kinematics, age and associated mapped faults/features of each boundary can be found within the model and, more extensively, in the digital layer 1:2 500 000 Major Crustal Boundaries. The positional accuracy of these boundaries is low, due primarily to their crustal scale and uncertainties in interpreting the primary data sources, and consequently this map is best used at the nominal scale or smaller. This model should be viewed as a geologically constrained, albeit non-unique, interpretation of sparse geoscience data rather than a precise geolocated 3D map.
For further information contact:
3D.geoscience@dmirs.wa.gov.au